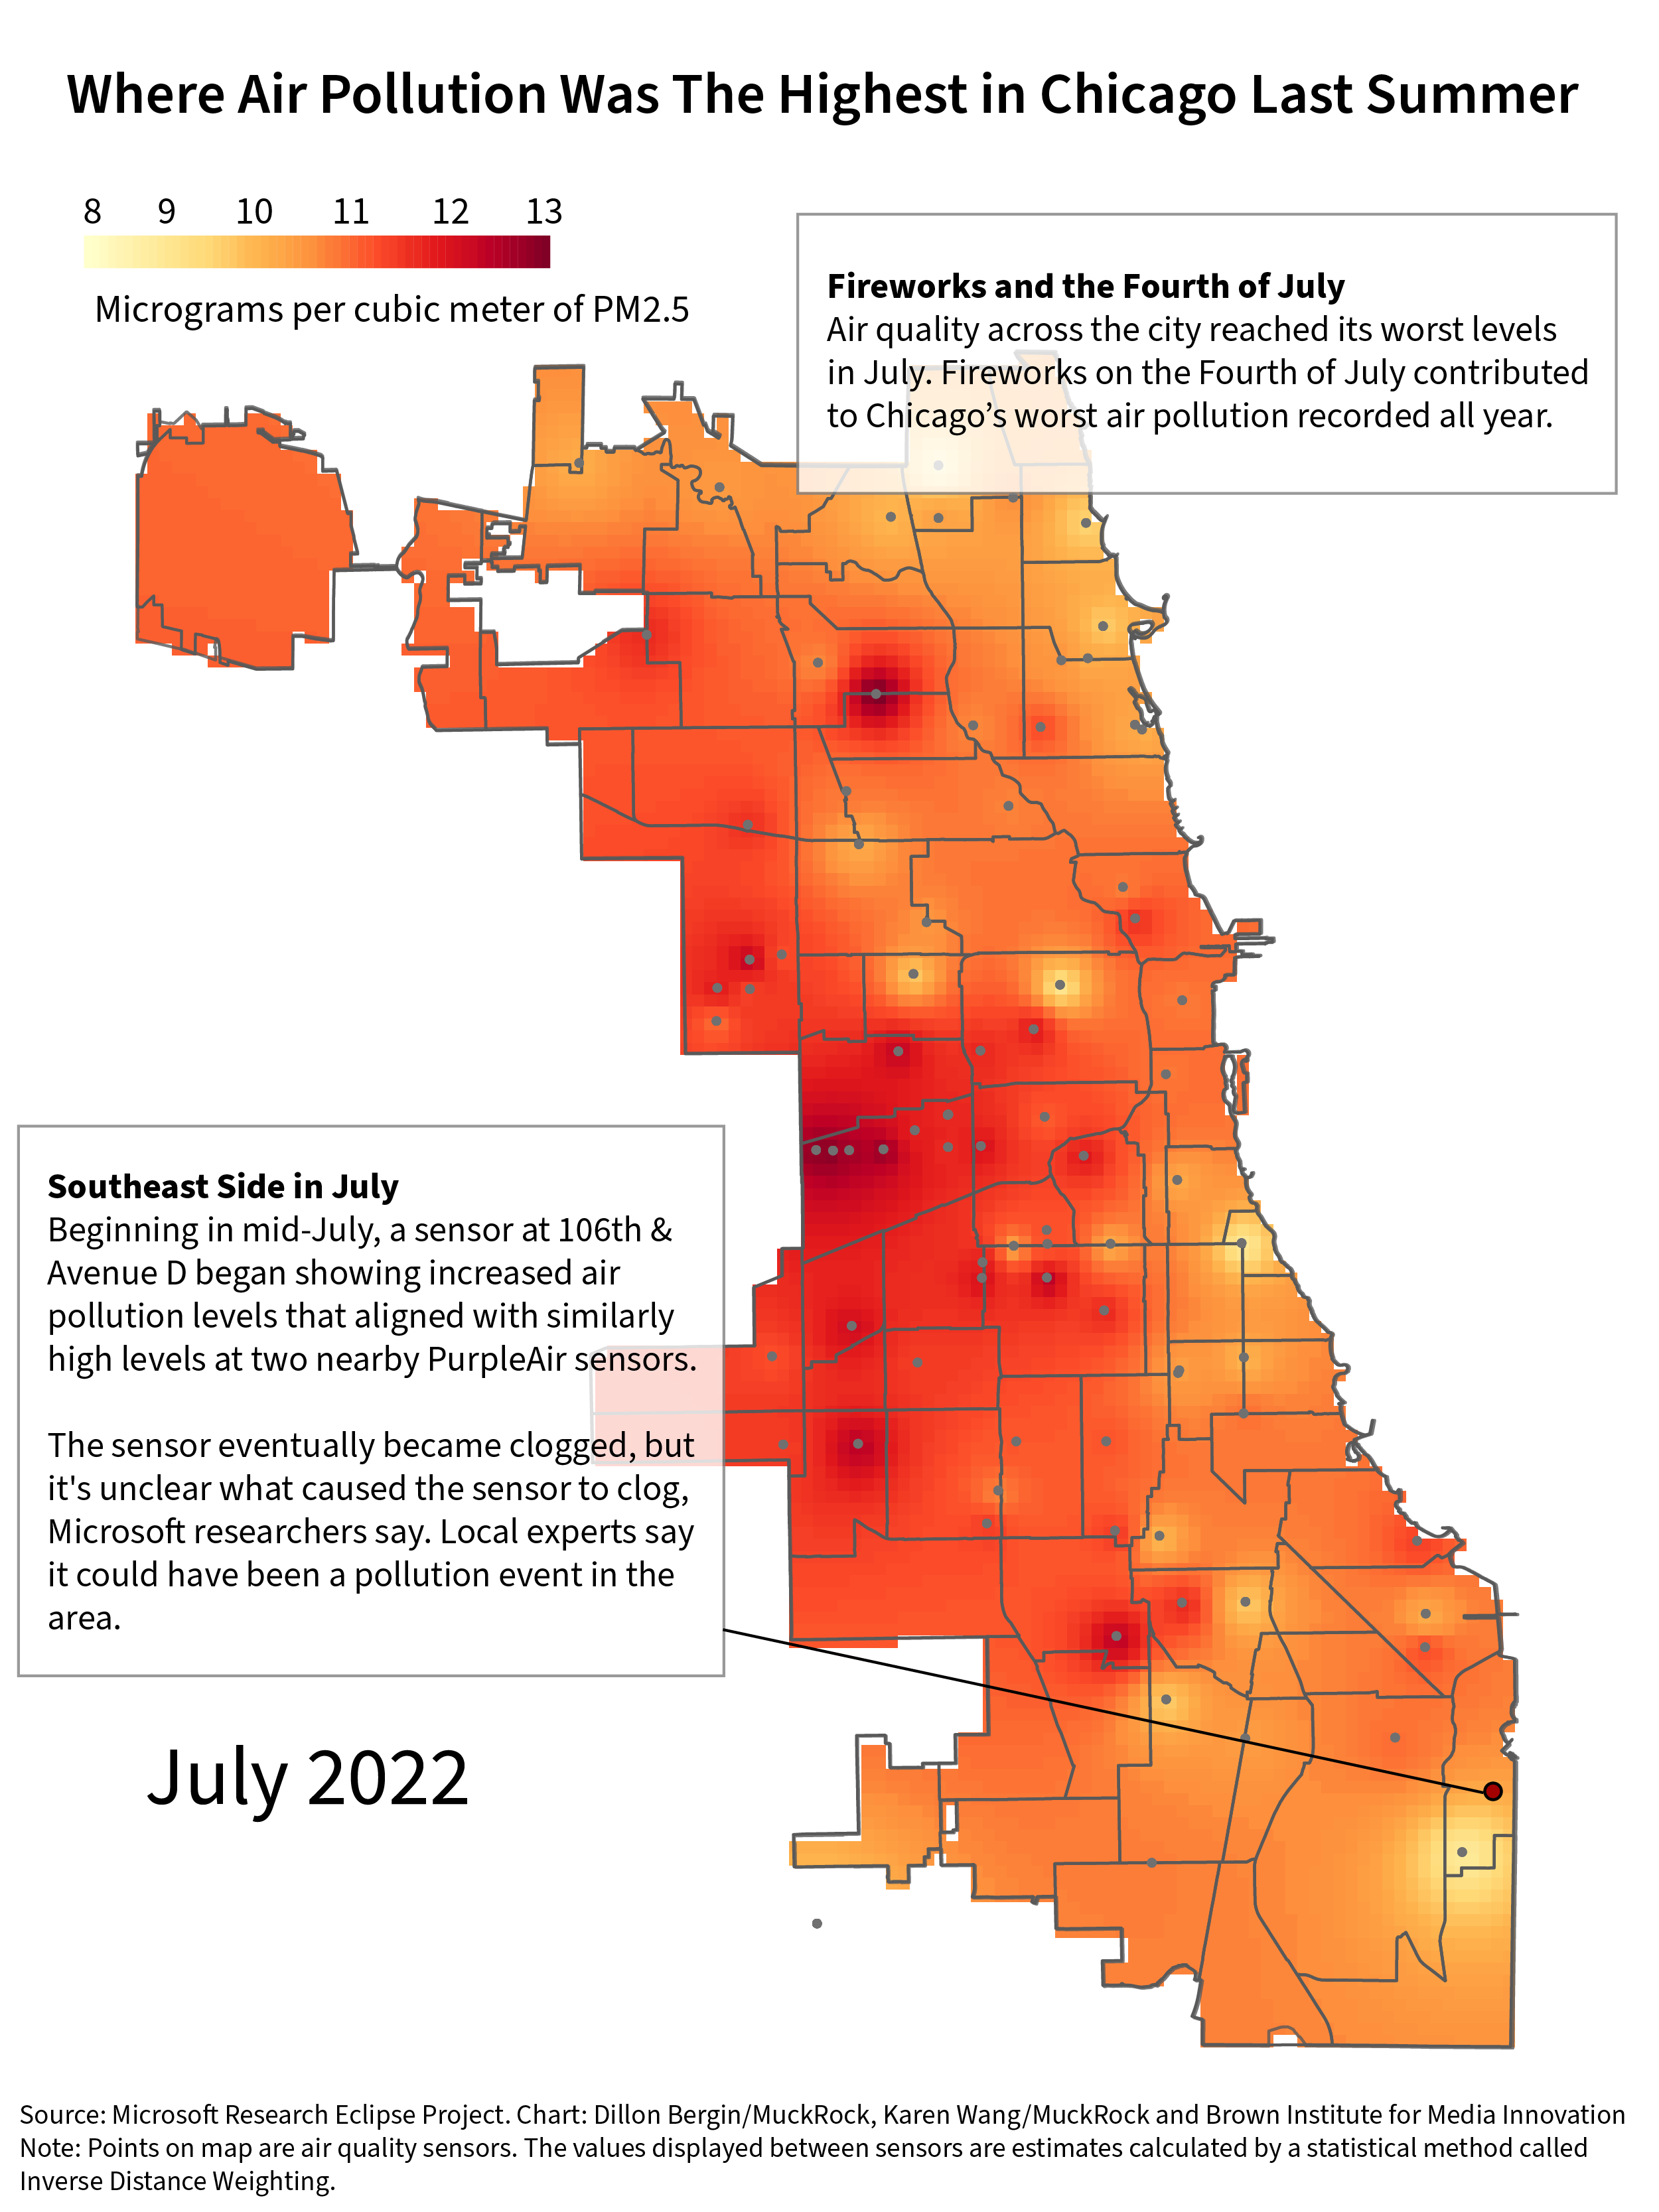
In mid-July, near 106th and Avenue D on Chicago’s Southeast Side, air pollution began to climb to a level that data from nearby sensors suggest is rare outside of the Fourth of July — historically the city’s worst day for air quality.
On July 21, three different air quality sensors in the neighborhood captured levels of particulate matter — tiny particles of smoke, dust and other compounds that can enter a person’s lungs and cause devastating health problems, including premature death — in the air about twice the level of pollution from the week before.
“This is really concerning, especially in the summer, when there’s a ton of kids outside and people are walking around,” said Gina Ramirez, a resident of Chicago’s Southeast Side and board member of the Southeast Environmental Task Force.
A sensor placed by Microsoft at a bus shelter on 106th and Avenue D became clogged, possibly by the high levels of air pollution, researchers say. The sensor has since been replaced by Microsoft.
Just a few blocks south of 106th, an air quality sensor installed as part of a Loyola University air pollution research project reached similarly high levels. A few blocks east of that sensor, near Jane Addams Elementary School, a sensor that MuckRock installed last summer at the house of a local family, recorded almost the same spike as the other two sensors.
In response to the findings, the Chicago Department of Public Health said in a statement that although they are unaware of any specific pollution event on the Southeast Side in July, they do respond and investigate citizen complaints and inspections of facilities that hold air pollution permits. “We are in the beginning stages of building out a system to actively ingest, analyze and utilize such data,” the department said. The city also said it uses Microsoft’s air pollution data “primarily to monitor trends over time, rather than discrete events.”
The Illinois EPA operates 11 monitors for particulate matter in Cook County. So far in 2022, none of these monitors have detected pollution levels that exceed national air quality standards — defined as 12 micrograms per cubic meter on an annual basis and 35 micrograms over 24 hours, the EPA said in a statement.
Meleah Geertsma, director of environmental justice policy for the Natural Resources Defense Council, a nonprofit environmental advocacy group, said in a statement that although it hasn’t studied the Microsoft sensor network data, “it is not surprising that sensor networks are picking up elevated levels of pollution near industrial areas and associated traffic corridors.”
“Moreover, all too frequently high levels of pollution such as seen here occur in low-income and BIPOC communities, which are also more vulnerable to such pollution,” she said. “Chicago needs to address these systematic disparities and injustices.”
Chicago has allocated more than $1 million of funding from the American Rescue Plan to an environmental impact statement that will provide data on where pollution is coming from and which areas of the city have suffered the most. The agency says the findings will then be used to make changes to the city’s permitting and inspections, land use and zoning, and even transportation planning.
The ultimate reason for the Southeast Chicago air pollution spike in July is, so far, unexplained, researchers and experts say, but Chicago’s 10th Ward, which encompasses several neighborhoods on the Southeast Side, has a long history of pollution from industry lining the banks of the Calumet River. On the other side of the neighborhood, diesel trucks pass through on the way to Indiana and locomotives move freight through the country’s busiest cargo hub, which has led to back-ups and increased pollution during the pandemic.
What you breathe depends on what your ZIP code is
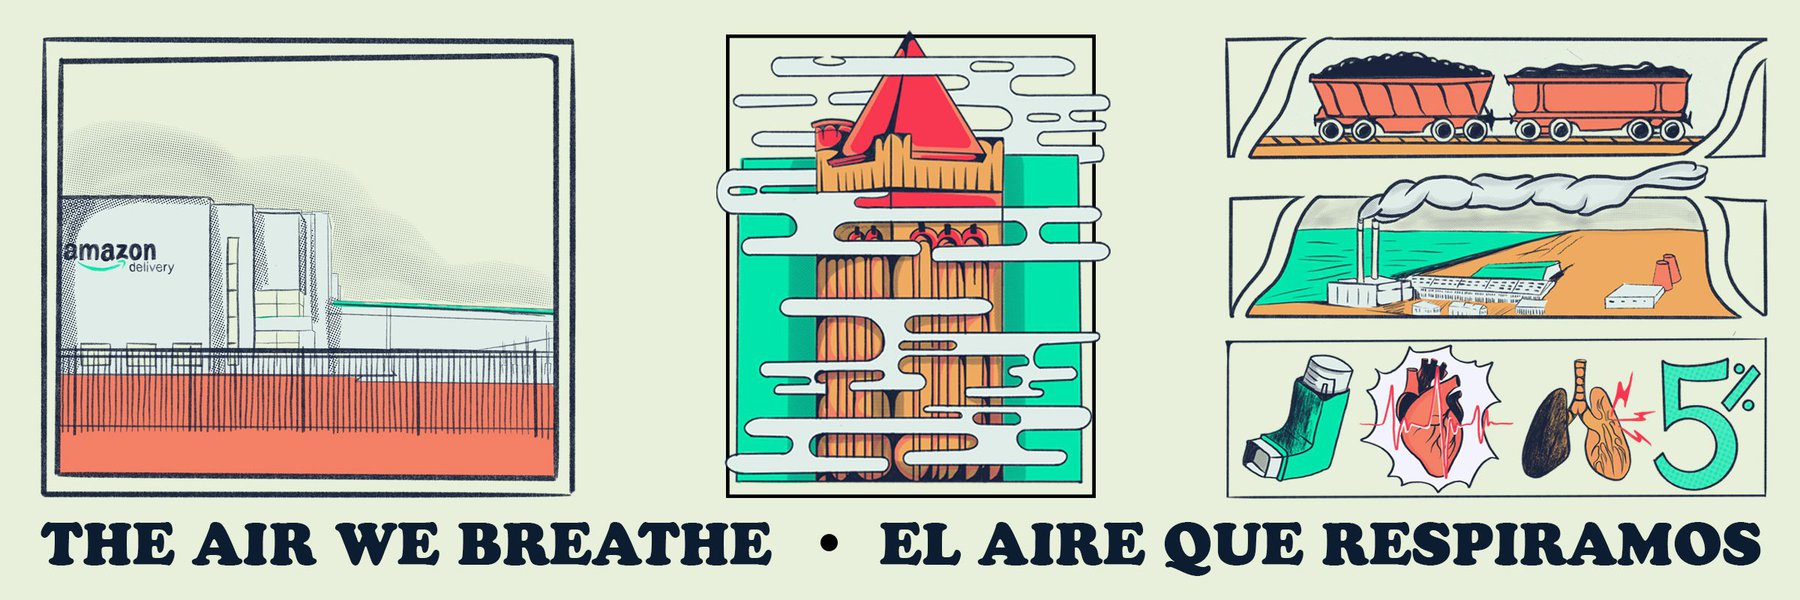
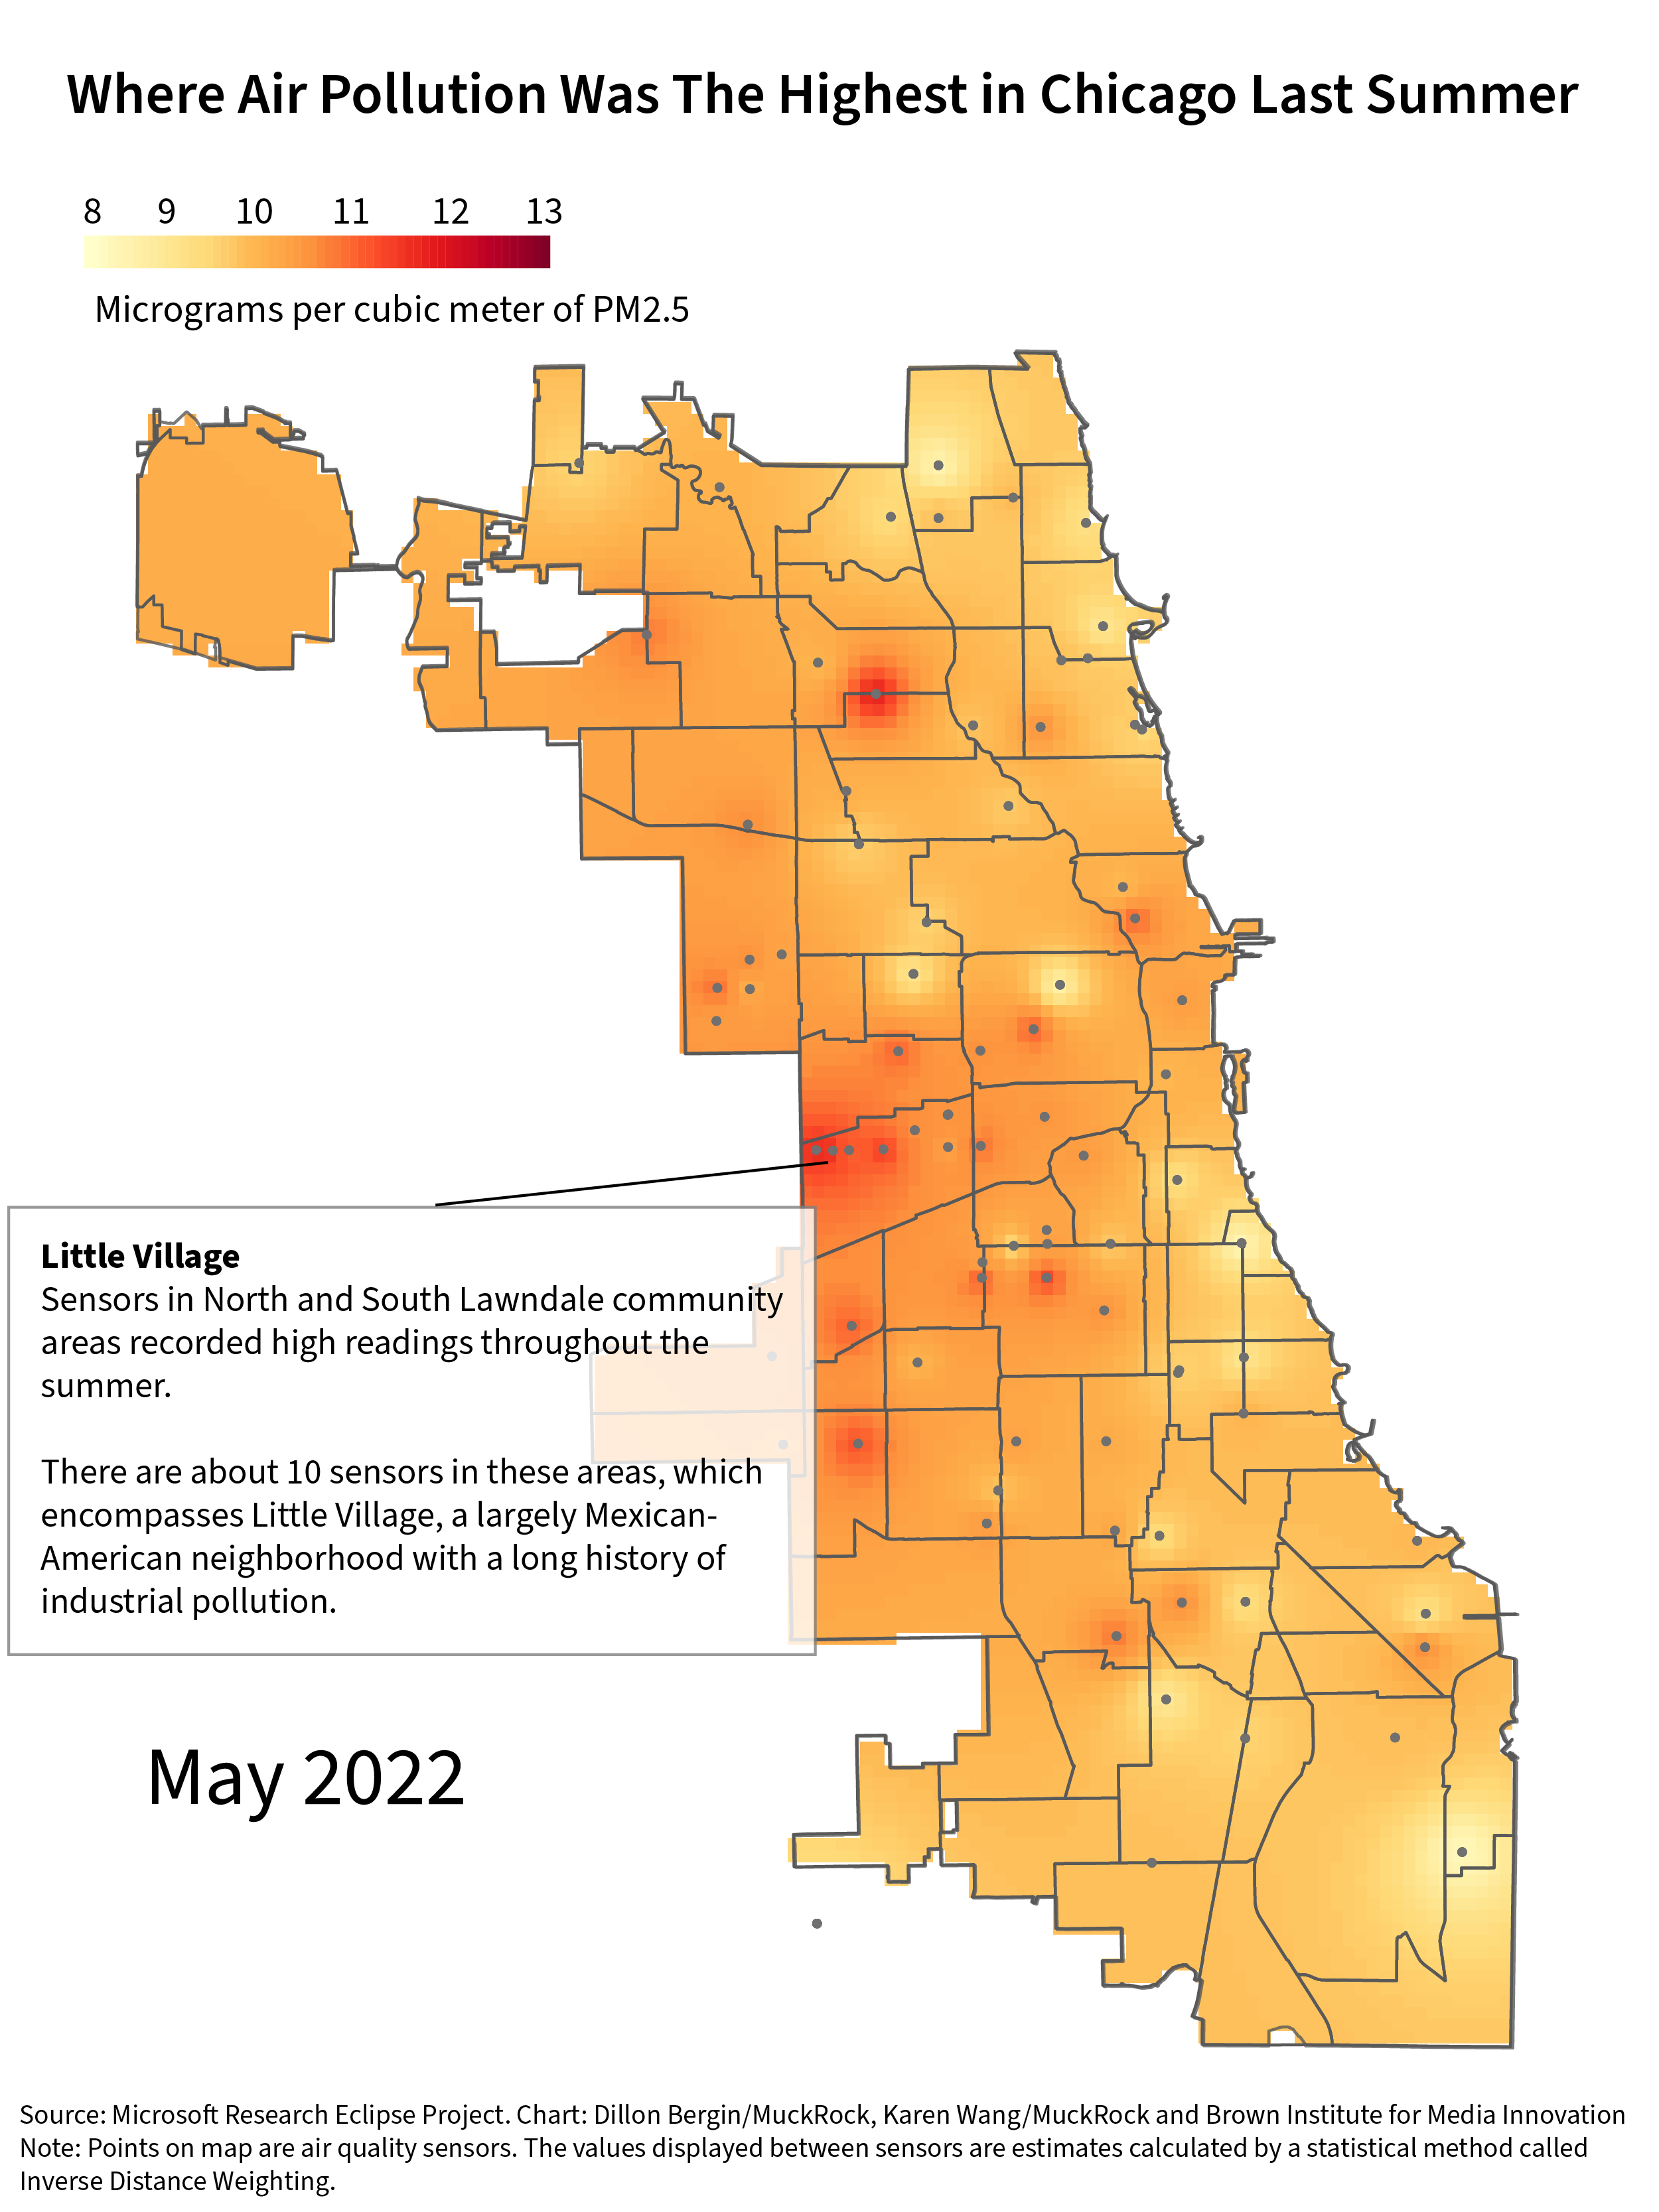
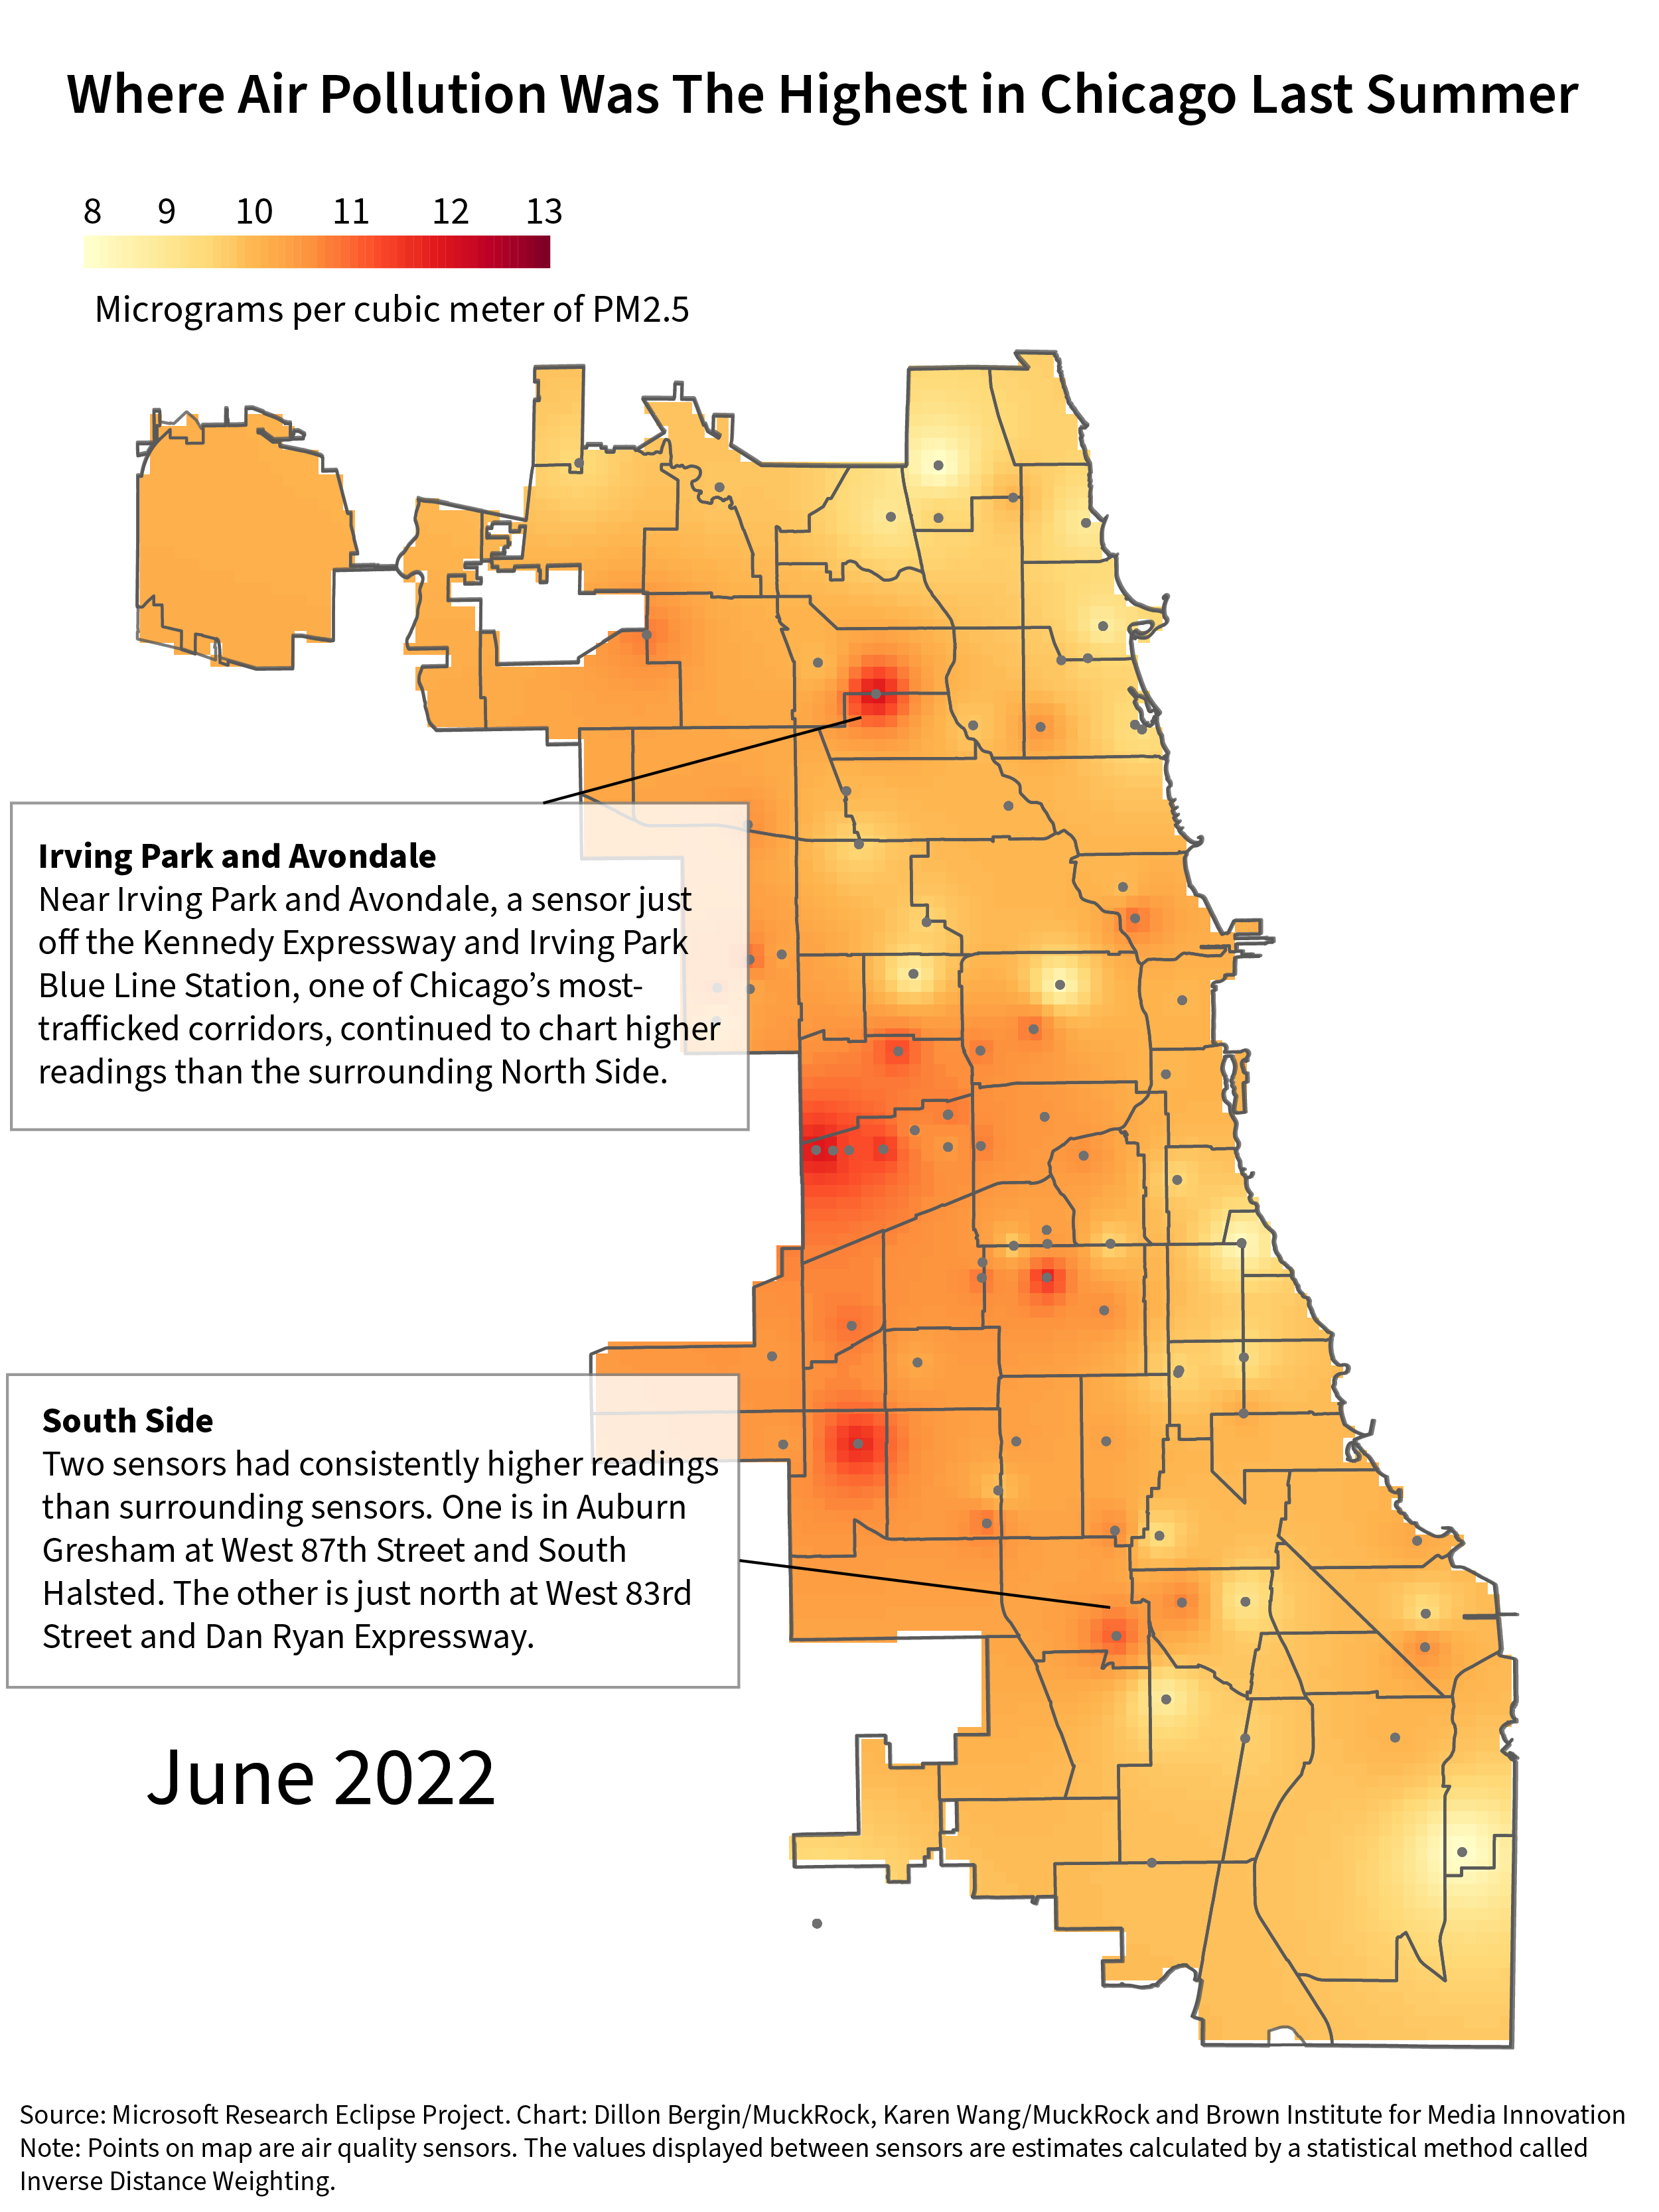
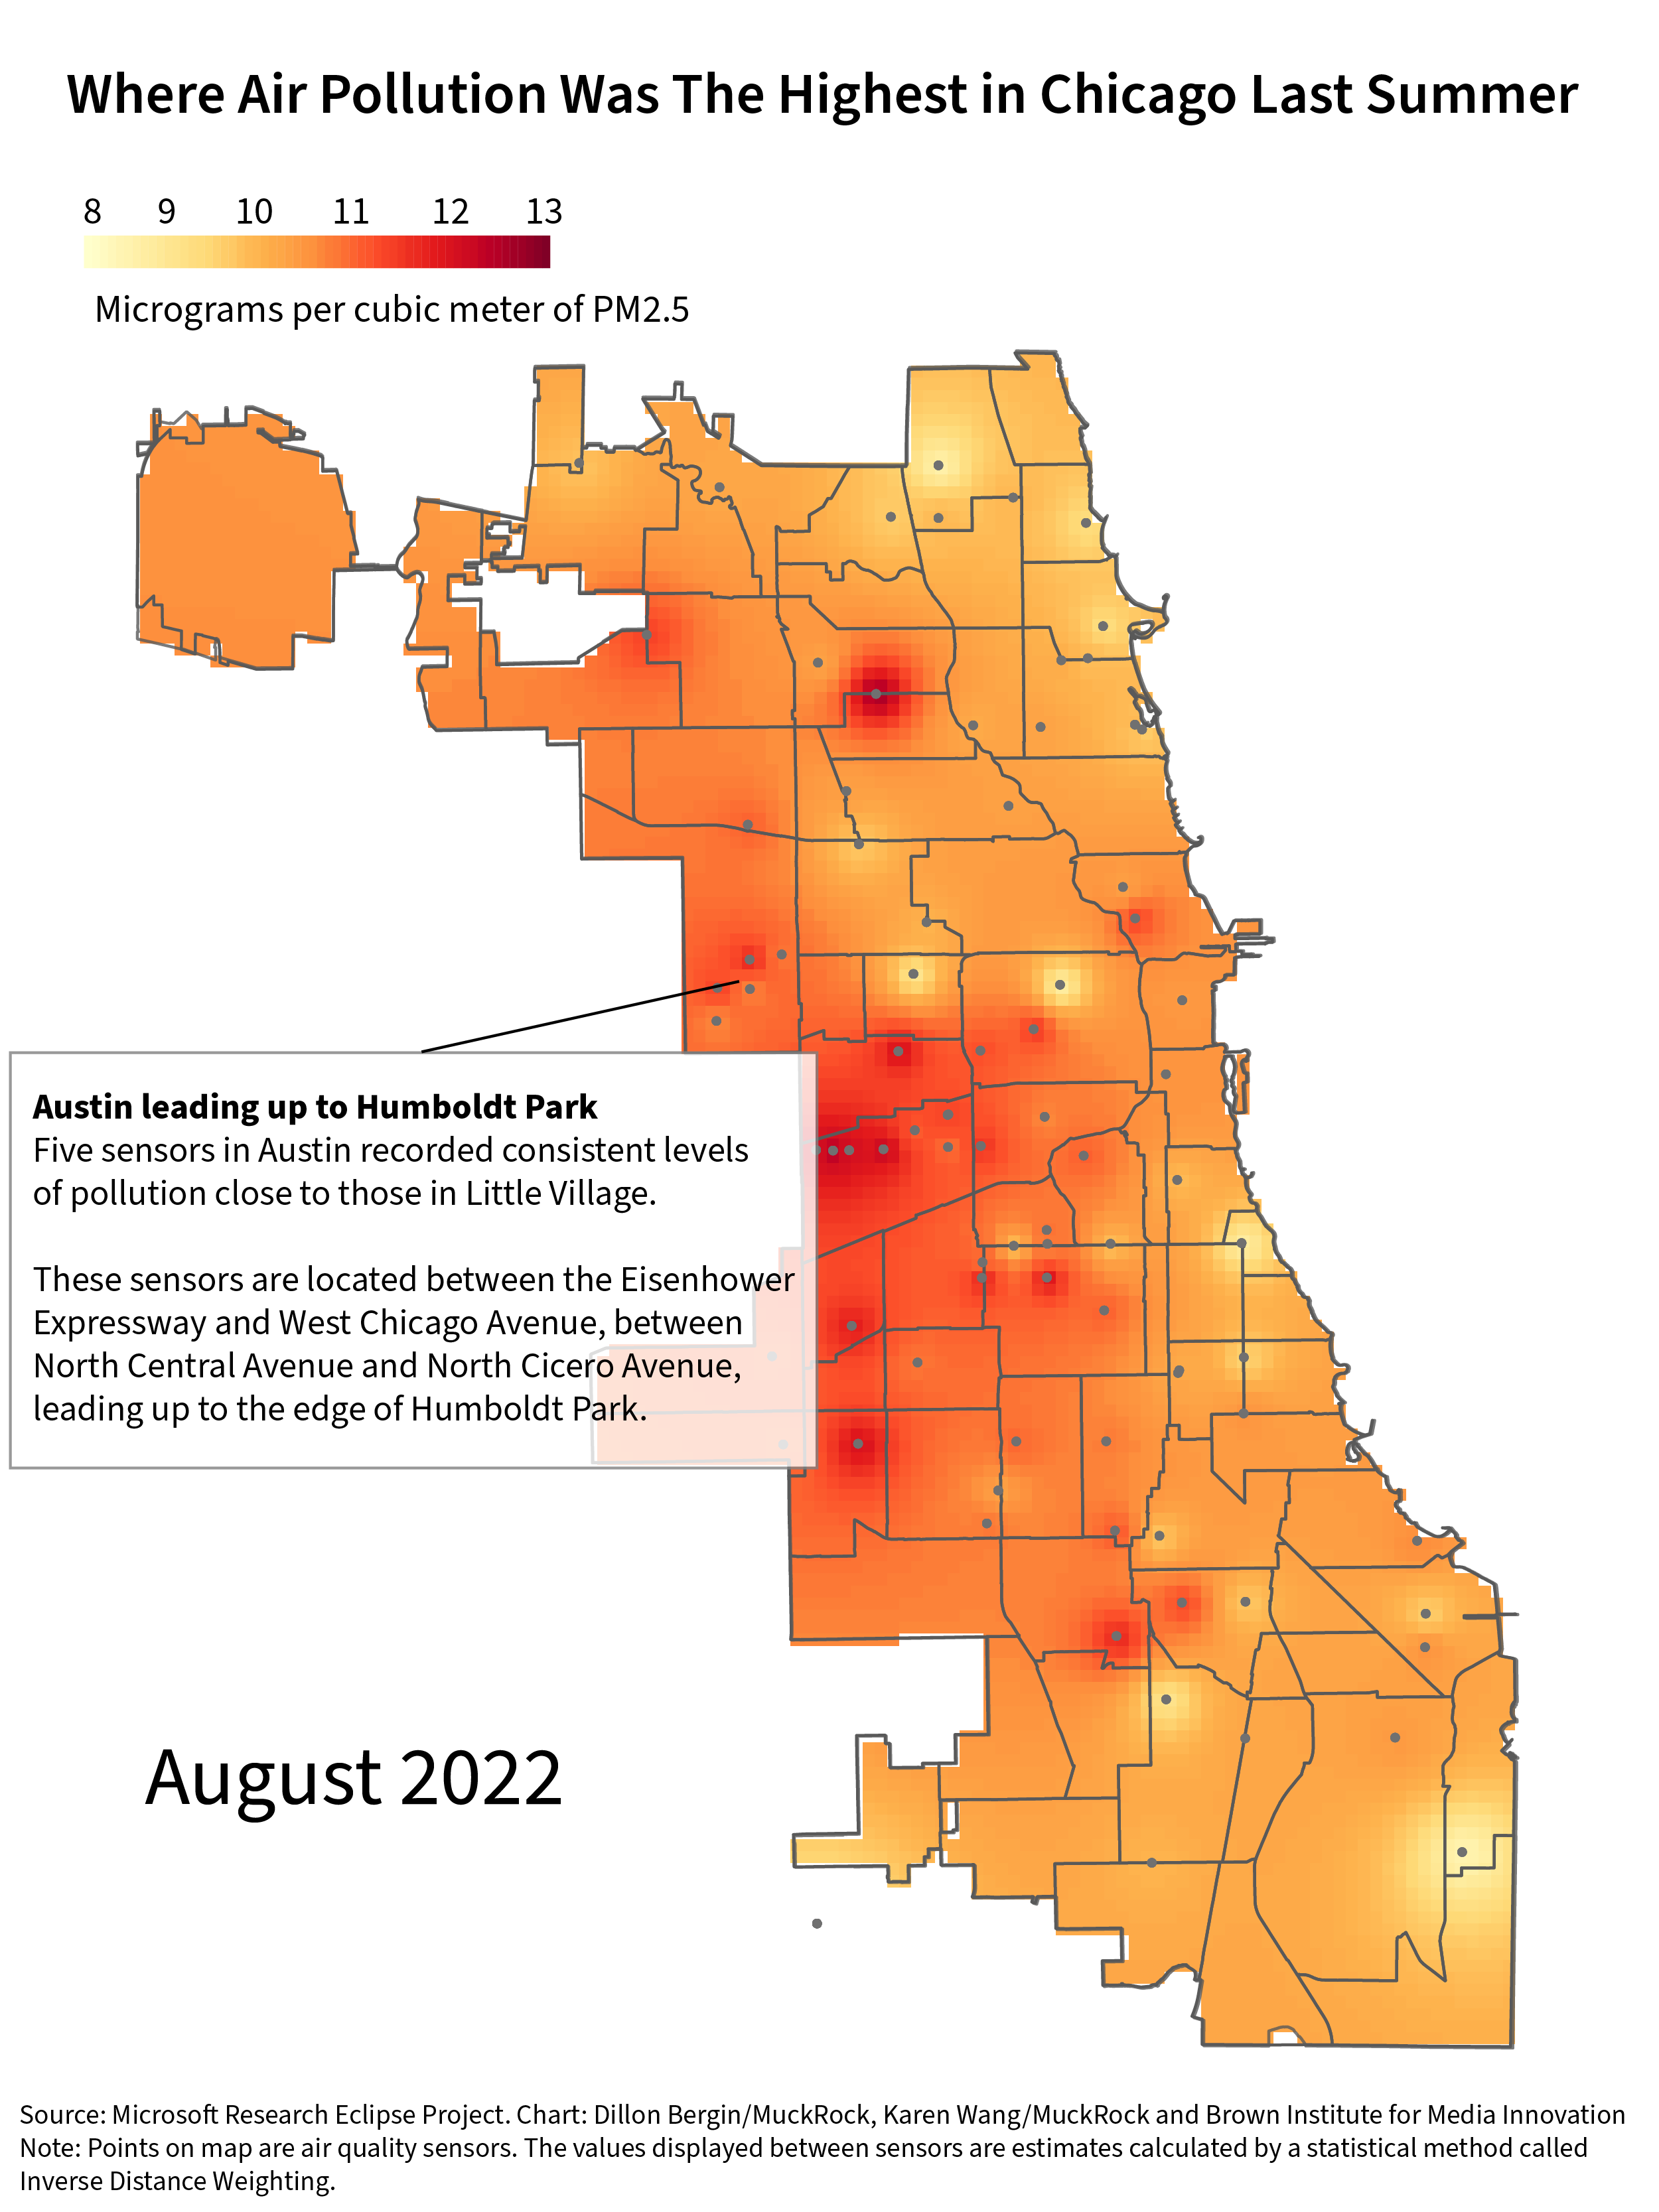
In Chicago, the city’s air absorbs pollution from diesel trucks, traffic-clogged expressways, manufacturing plants handling materials like concrete or petroleum coke, and even fireworks on the Fourth of July. While dirty air is a danger to residents across the city, Chicagoans in areas like Little Village or the Southeast Side live closer to sources of toxic pollution.
![]()
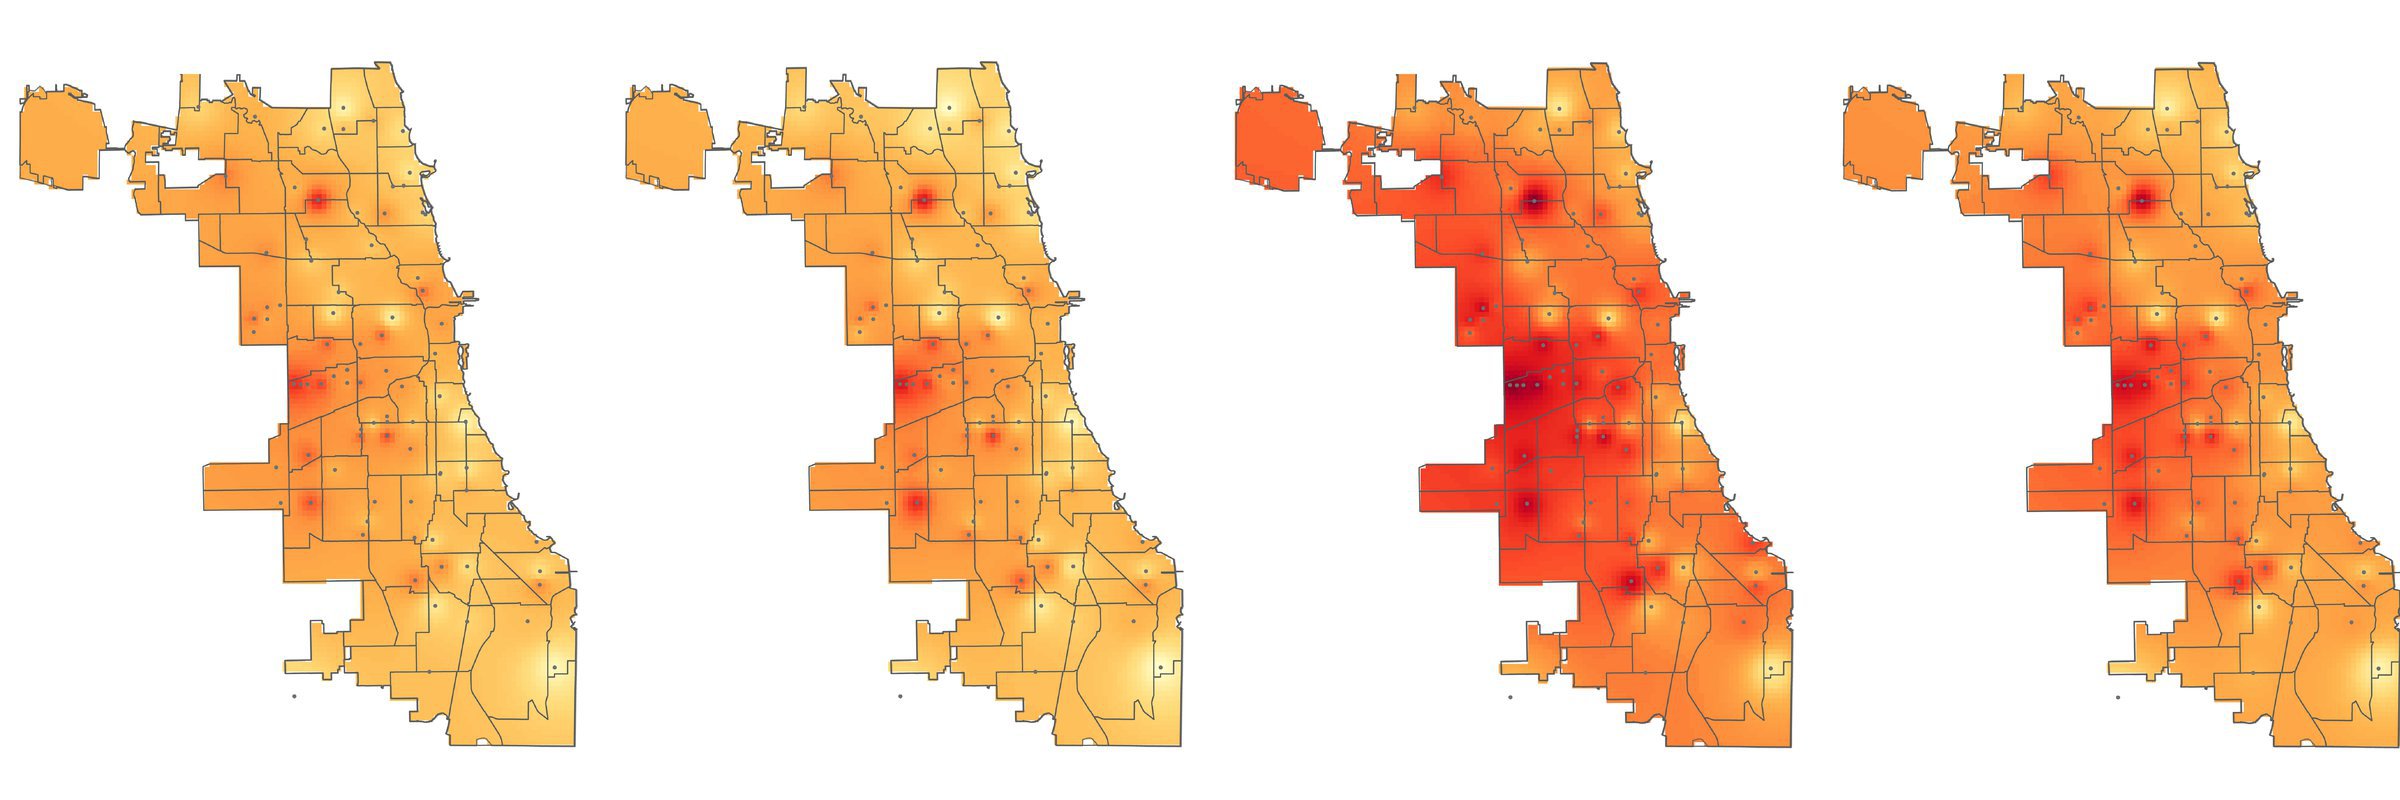
This summer, MuckRock and Columbia University’s Brown Institute for Media Innovation, working with Chicago newsrooms, published the first part of our ongoing series quantifying the widely different levels of air pollution across city neighborhoods.
Click on the arrow below to see annotations for hotspot for each individual month:
Now, we want to help Chicago keep track of what residents are breathing, especially during time periods air pollution is visibly rising.
As part of a grant through Northwestern University Medill and Google News Initiative’s Data Driven Reporting Project, MuckRock is retrieving daily air quality readings from a network of more than 100 air quality sensors across Chicago. This network of sensors was built as part of a partnership between the tech company Microsoft, the City of Chicago and several community organizations. The data from the sensors is public. At a level of detail that few other environmental studies in the U.S. have reached, the air quality readings from each sensor reveal how the city’s pollution varies by neighborhood.
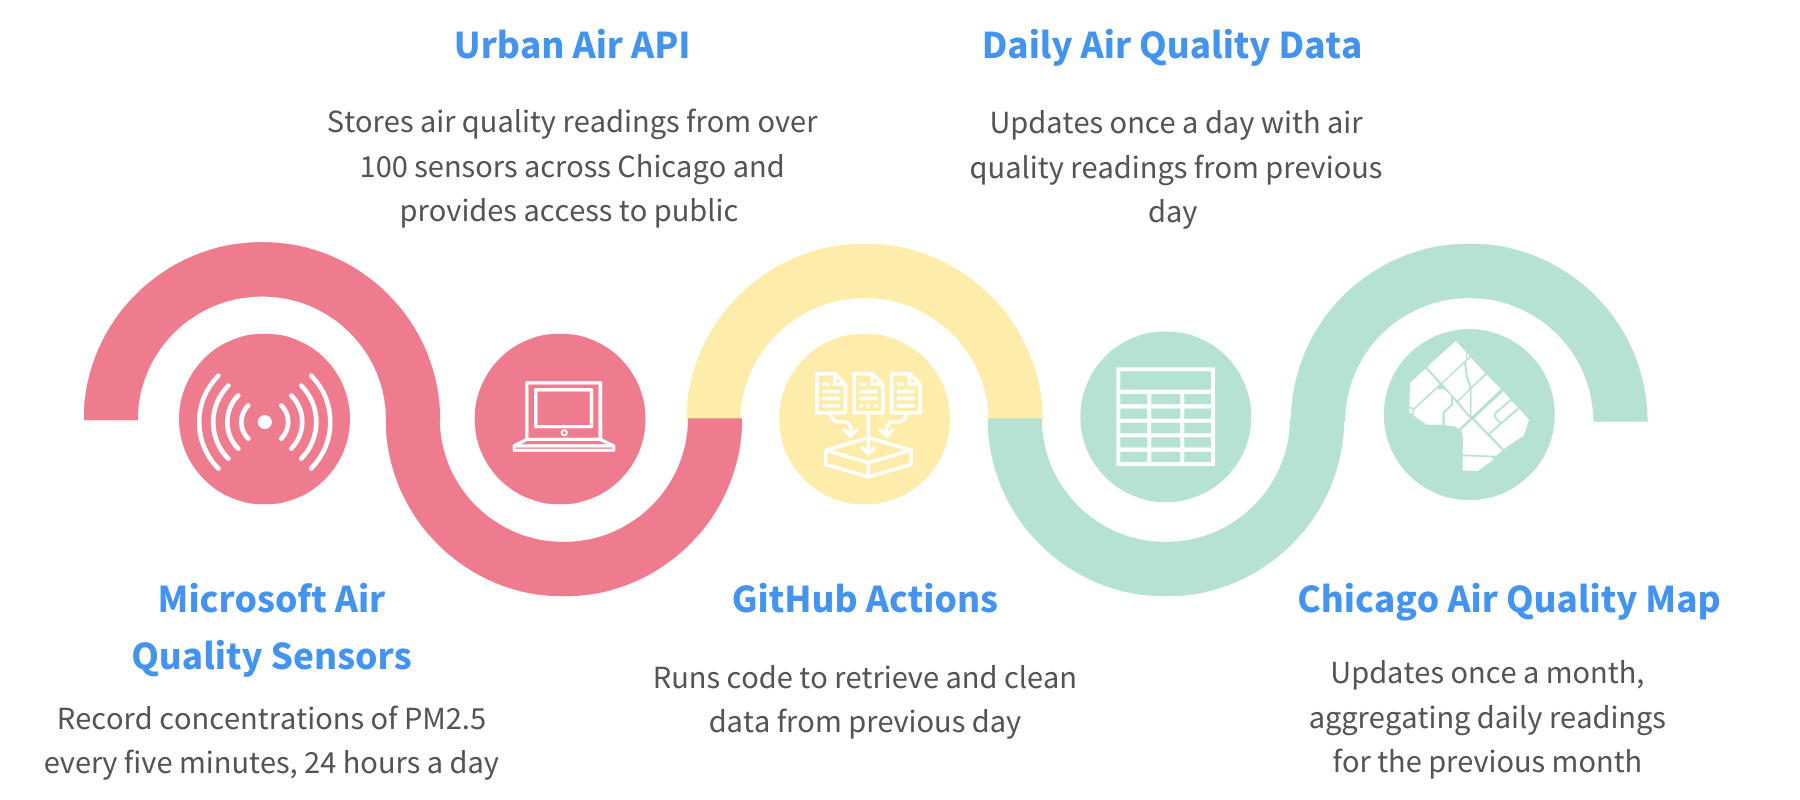
We know there’s a difference between public information, and information that is easily accessible. The sensors record air quality readings every five minutes, every hour of the day, resulting in millions of rows of data. Getting, storing and cleaning all of that information is difficult and time-consuming. That’s why we’re handling the first few steps of data collection and analysis. Through GitHub Actions, air quality readings will be updated daily and visualized maps will be updated monthly.
If you want to know more about our process and methodology, you can read the documentation in our GitHub repository or a longer write-up of our methodology.
What newsrooms, civic groups and the public can do with Chicago’s air quality data
-
Look for neighborhood sensors, compare them to the rest of the city, and keep track. Find a sensor in a given neighborhood and calculate its daily average. How does that compare to sensors around the city? You can check back to where we’re storing new data with an eye for days when the average goes above that number.
-
Check the new daily data on days that you notice something outside. Do you remember a day this month where something wasn’t quite right with the air near your home? Are you sure that air quality is worse some days of the week than others? Homing in on sensors for a single day’s average can help you pinpoint what the air quality was like near that sensor on a day you’re concerned about.
-
Zoom out to monthly changes and in on hourly data. Do you notice the daily data from a sensor is consistently higher or lower than usual? This could be due to seasonal changes, so it’s important to look at data from previous months. On the other hand, something more immediate, such as smoke from a distant wildfire, may be causing changes in air pollution levels. Our daily data pulls are averages for all readings throughout the day, but you can also dig into hourly data for a specific day by tweaking our code so it doesn’t aggregate to hourly.
-
Use our air quality public records series to dig deeper. We’ve written about how to ask what your local government its doing to protect your air, how to get air pollution permits and emissions inventories, and how to find complaints, violations and fines to pinpoint local polluters. Use our guides and go ahead, you can even copy our requests.